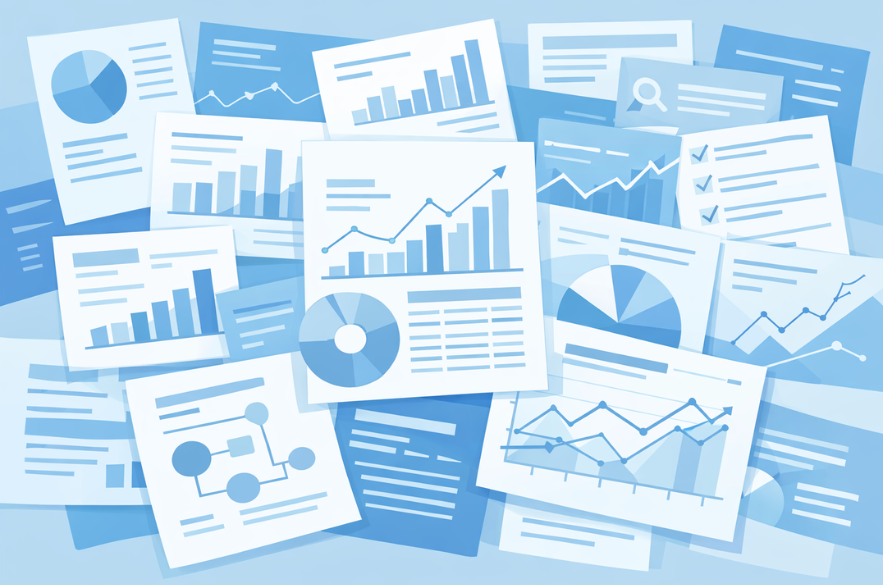
For many small and medium-sized businesses, dashboards feel like progress. Data is finally visible. Metrics are tracked. Charts update automatically. Leadership meetings include screenshots instead of spreadsheets.
And yet, despite all this reporting, decisions often remain slow, reactive, or inconsistent. The problem isn’t a lack of data. It’s a lack of decision-ready insight.
Dashboards are useful, but on their own they rarely change behaviour. To understand why, and what actually works instead, we need to look at how people make decisions and where dashboards fall short.
The Dashboard Illusion: Visibility Without Understanding
Dashboards are designed to answer the question: “What is happening?”. They summarise performance, surface trends, and provide a snapshot of activity. That visibility is valuable but it’s only the first step in decision-making.
Research from Harvard Business Review shows that organisations often confuse data availability with data usability. Leaders assume that once information is visible, better decisions will naturally follow. In reality, most dashboards increase awareness, not clarity.
This explains a common pattern in SMBs:
- Dashboards are reviewed regularly
- Meetings discuss numbers at length
- Decisions are still made based on instinct or precedent
The dashboard becomes a reporting artefact, not a decision tool.
Why Dashboards Rarely Change Decisions
1. Dashboards Describe, They Don’t Explain
Most dashboards are descriptive. They show:
- What happened last week
- What is up or down
- How this month compares to last month
What they don’t show is:
- Why it happened
- What caused the change
- What should be done next
According to McKinsey, organisations that rely primarily on descriptive analytics struggle to translate data into action, because descriptive data does not reduce uncertainty, it simply reports it.
2. Dashboards Assume Analytical Confidence That Often Isn’t There
Dashboards are often designed by analysts, for analysts, but consumed by non-technical leaders. This creates a hidden problem, many users see the data but don’t feel confident interpreting it.
Research into data literacy by Gartner highlights that low data literacy is one of the biggest barriers to becoming data-driven. When users don’t trust their interpretation, they fall back on experience or intuition.
This leads to a paradox:
- Data is present
- But decisions avoid relying on it
Dashboards don’t fix this. Context does.
3. Metrics Are Rarely Aligned to Decisions
Another issue is misalignment. Dashboards often track:
- What is easy to measure
- What has always been reported
- What tools provide by default
But decision-makers care about:
- Risk
- Trade-offs
- Priorities
- Consequences
A dashboard might show conversion rates, revenue, and traffic, but not answer:
- Which customer segment should we focus on next quarter?
- Which process is causing the most operational friction?
- Where should we invest to get the best return?
The OECD notes that data only becomes valuable when it is directly connected to policy or business decisions, otherwise it remains informational, not transformational.
From Reporting to Insight: What’s Missing
To move beyond dashboards, businesses must shift from reporting to insight generation.
Insight answers three questions dashboards usually don’t:
- Why is this happening?
- What is likely to happen next?
- What should we do differently?
This requires three additional layers.
1. Contextual Analysis
Context explains why a metric matters.
For example:
- A dip in conversion rate means very different things depending on traffic source, customer intent, or recent changes.
- A rise in costs may be acceptable if it supports long-term retention or risk reduction.
Context turns raw metrics into business meaning. Harvard Business Review emphasises that contextual framing is essential for decision-making, particularly for non-technical leaders.
2. Diagnostic and Predictive Thinking
Dashboards look backwards. Decisions look forwards. According to McKinsey, high-performing organisations move beyond descriptive dashboards and adopt diagnostic (“why did it happen?”) and predictive (“what will happen?”) analysis.
For SMBs, this doesn’t mean complex AI systems. It often means:
- Trend analysis
- Scenario comparison
- Simple forecasting
- Identifying leading indicators, not just lagging ones
These approaches directly reduce uncertainty, which is what decisions require.
3. Decision-Centred Design
The most effective analytics environments start with decisions, not dashboards.
Instead of asking:
“What should we put on the dashboard?”
High-maturity organisations ask:
“What decisions do we need to make regularly?”
Then they design analytics to support those decisions explicitly.
The MIT Sloan Management Review notes that decision-centred analytics significantly improve business outcomes compared to metric-centred reporting.
How to Move from Dashboards to Decisions
The shift does not require enterprise-level budgets. It requires a mindset change.
- Identify your critical decisions
Focus on the decisions that have the biggest impact: pricing, resource allocation, customer focus, risk management. - Map what information those decisions actually need
Not all metrics are equal. Some inform action, others simply describe activity. - Add interpretation, not just visualisation
Use commentary, benchmarks, and scenarios to explain what the data means. - Review outcomes, not just metrics
Measure whether decisions improved results, not whether dashboards were updated.
This approach turns analytics into a strategic asset, not a reporting function.
Conclusion
Dashboards are not the enemy, they are simply incomplete. They show what is happening, but rarely explain why, predict what’s next, or guide what to do. Without context, interpretation, and decision alignment, dashboards create visibility, not clarity.
Better decisions come from insight, not information. For businesses willing to move beyond reporting and design analytics around real decisions, data becomes a competitive advantage not just a monthly slide deck.
At I-Net Software Solutions, we help UK SMBs go beyond static reporting by designing decision-driven dashboards that answer the questions leaders actually need to act on, not just what happened, but what to do next.
If your dashboards look good but don’t change behaviour or outcomes, we offer a Dashboard & Insights Review to help you:
- Identify which metrics truly matter for decision-making
- Remove noise and misleading indicators
- Align dashboards to operational and commercial goals
- Turn reporting into clear, actionable insight