Endpoint Security vs Antivirus: What Actually Protects Your Business Today?
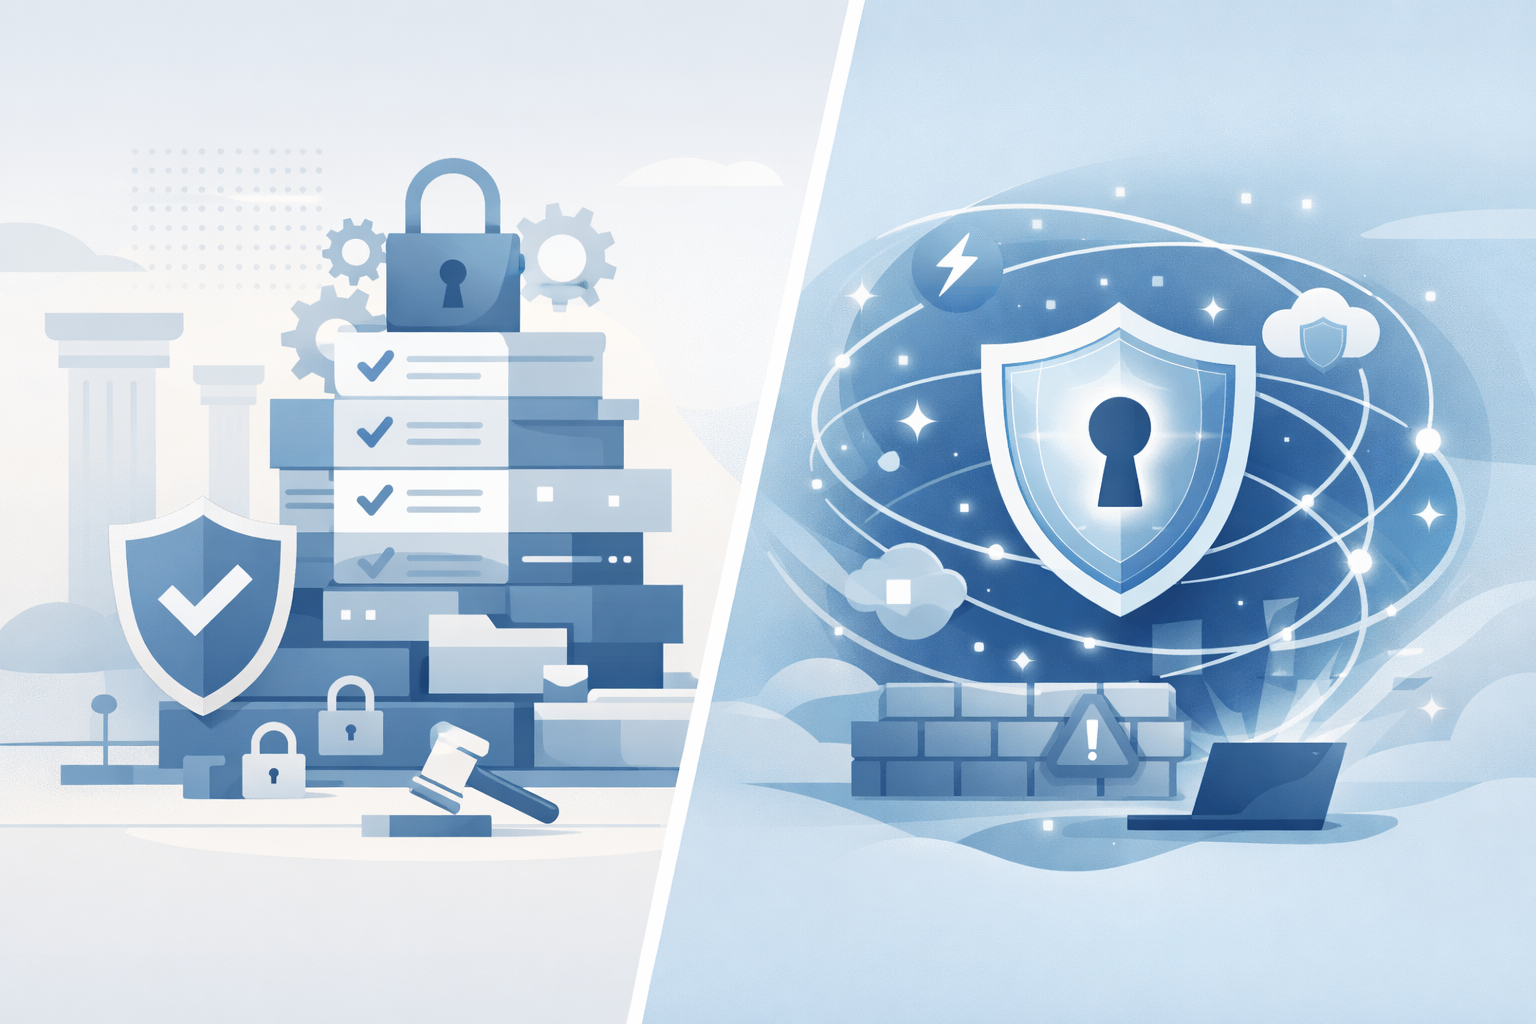
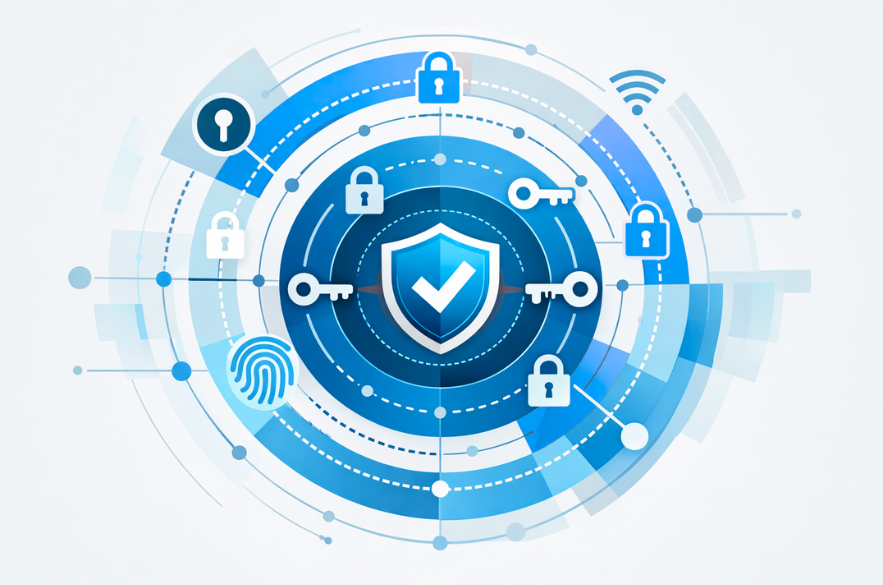
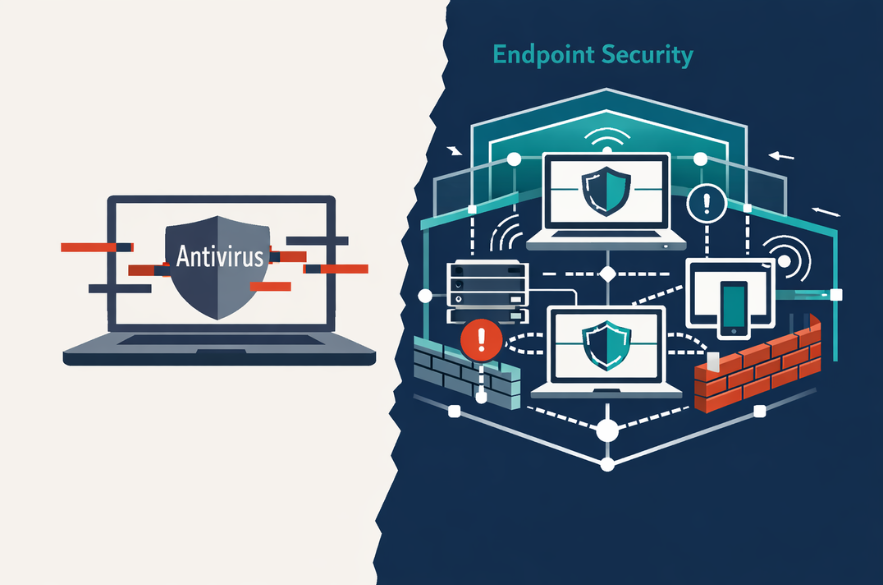
The threat landscape has shifted from simple malware to multi-stage attacks involving: The Verizon Data Breach Investigations Report consistently shows that human error, stolen credentials, and system vulnerabilities remain primary entry points for attackers. This means protection must go beyond blocking known threats. It must detect and respond to unknown behaviour. What Antivirus Was Designed to Do, And Where It Falls Short Today Traditional antivirus was built for a different era. Signature-Based Detection Antivirus tools identify threats by matching files against a database of known malware signatures. This works well for previously identified threats but struggles with new or evolving attack methods. The Problem With Modern Threats Modern cyber attacks often use: These techniques do not match known signatures. Reactive Security Antivirus acts after a threat is recognised. By that point, damage may already be underway. This reactive model is increasingly insufficient in a threat environment that evolves in real time. What Endpoint Security Actually Includes Endpoint security represents a broader, more modern approach. It combines prevention, detection, and response into a single operational framework. Endpoint Protection vs Detection Endpoint protection includes baseline safeguards, but modern systems extend this with continuous monitoring. Role of EDR (Endpoint Detection and Response) EDR tools analyse behaviour across devices to identify suspicious activity, even when no known malware signature exists. Continuous Monitoring Instead of waiting for known threats, endpoint security watches for anomalies, unusual behaviour, and system changes. Endpoint Security vs Antivirus: The Core Differences The distinction is not incremental. It is fundamental. Capability Antivirus Endpoint Security Detection method Signature-based Behavioural + AI-driven Threat coverage Known threats Known + unknown threats Response capability Limited Active response & containment Visibility Device-level Network-wide visibility Protection model Reactive Proactive + reactive This is why the shift toward endpoint security is accelerating. Why Antivirus Alone Is No Longer Enough for Businesses The evolution of threats has outpaced traditional protection. The National Cyber Security Centre highlights ransomware as one of the most significant risks facing organisations, often involving techniques that bypass simple detection tools. Modern risks include: These require detection, visibility, and response, not just blocking Where Endpoint Security Delivers Real Business Value Endpoint security is not just a technical upgrade. It has operational impact. Reduced Breach Risk Faster detection limits the spread of attacks. Faster Incident Response Automated containment reduces downtime. Operational Continuity Systems remain functional during attempted attacks. Compliance Alignment Supports UK GDPR principles of security by design Cyber Insurance Readiness Insurers increasingly expect advanced endpoint controls. Do Businesses Need Both Endpoint Security and Antivirus? This is a common misunderstanding. Modern endpoint security platforms often include antivirus capabilities as one layer within a broader system. The real shift is not replacing antivirus, it is moving beyond it. Businesses are no longer choosing between the two. They are choosing whether to operate with: What UK SMBs Should Look for in Endpoint Security Solutions Decision-makers should focus on capability, not branding. Key considerations include: The goal is not simply protection, it is control and awareness. The Strategic Risk of Staying With Antivirus Alone The risk is not immediate failure. It is delayed detection. By the time a threat is visible, it may already have: This creates a gap between perceived security and actual resilience. What This Means for Business Leaders The shift from antivirus to endpoint security reflects a broader change in how cyber risk is managed. Security is no longer about blocking threats at the edge. It is about understanding activity across the organisation and responding quickly when something goes wrong. For SMEs, this is not about adopting enterprise complexity. It is about adopting modern protection that reflects modern risk. Understanding Your Current Level of Protection Many organisations assume their current setup is sufficient because no major incident has occurred. A more useful question is whether your current systems can: I-Net Software Solutions works with UK businesses to assess how endpoint security is currently structured and where gaps may exist between perceived protection and actual capability. For organisations navigating increasing cyber risk, clarity often becomes the most valuable starting point. FAQs Recommended Read